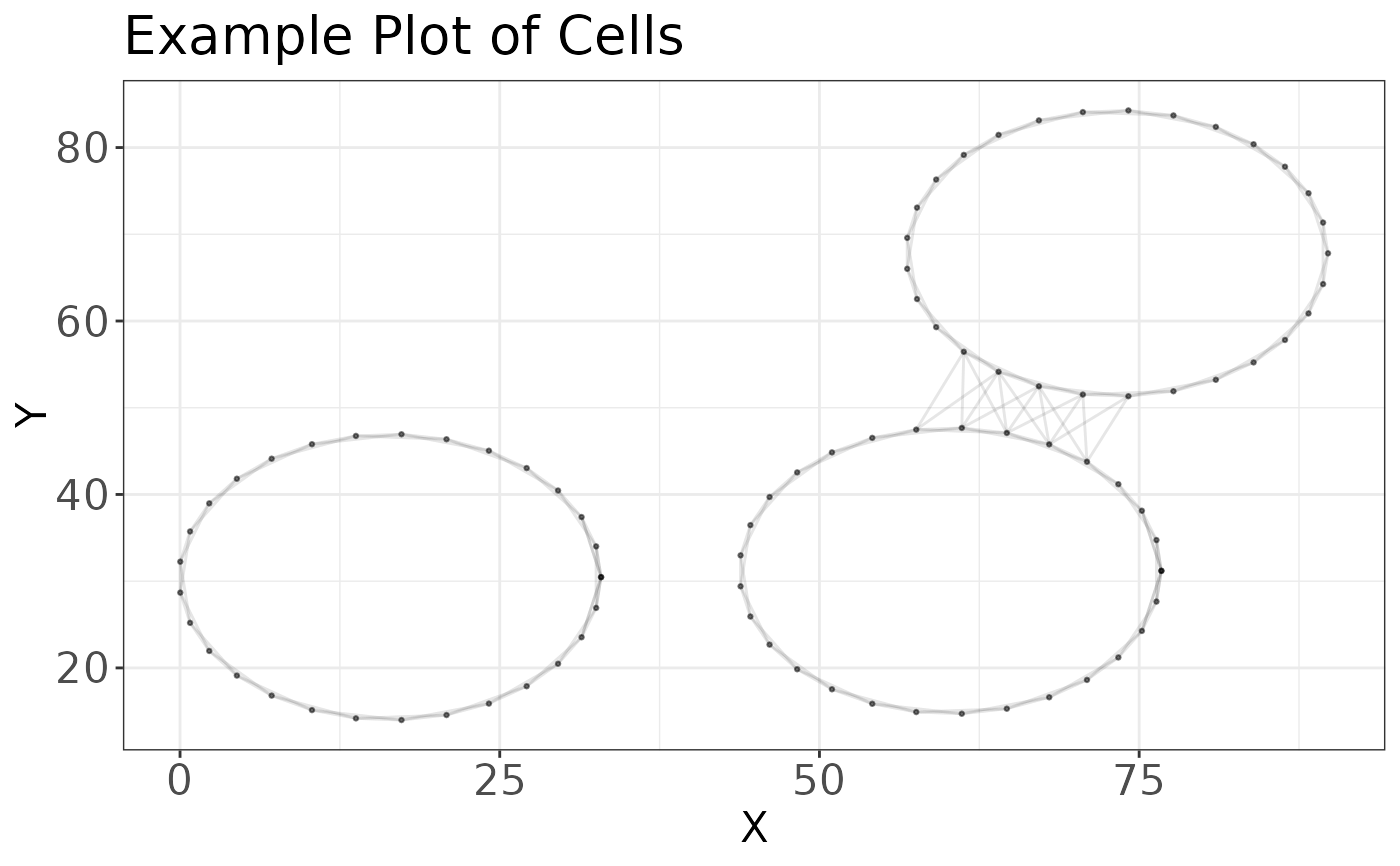
This function plots a simplicial complex with the cells as points and the
given radius value connecting them.
Usage
plot_cells_with_scale(image, threshold, title)
Arguments
- image
A data.frame containing the cell information for a single image.
- threshold
Radius to plot
- title
Title for the plot
Value
Returns a ggplot scatterplot of the data with edges of length
threshold connecting the cells.
Examples
require(magrittr)
plot_cells_with_scale(
  image = data1.df %>% dplyr::filter(PID == 51),
  threshold = 10,
  title = "Example Plot of Cells"
)