plot_persistence.Rd
Plot persistence diagrams
plot_persistence(PD, title, dims = c(100, 100))
Persistence diagram for a given image
Title for the output figure
Dimensions for the output figure
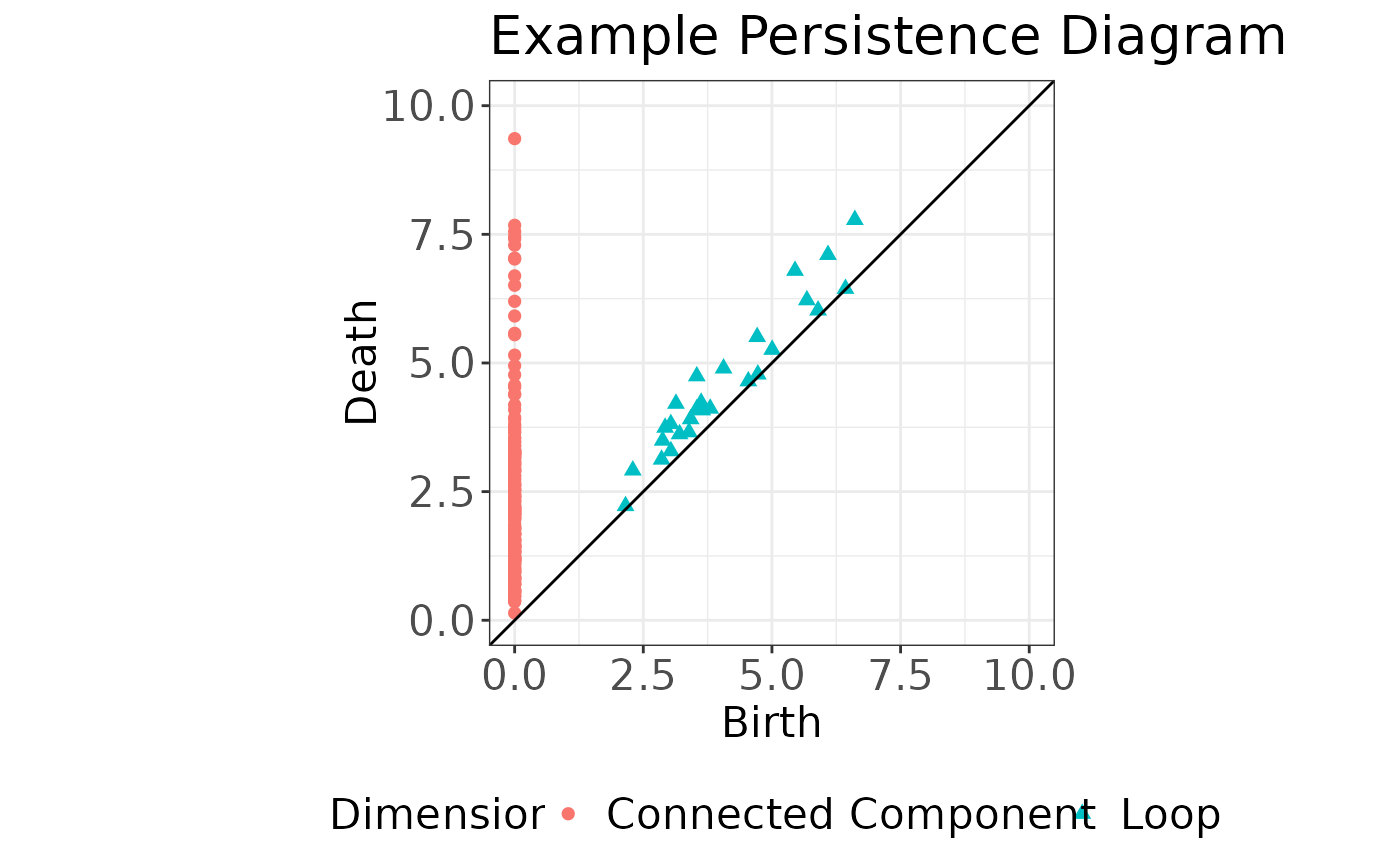
Plot illustrating the birth and death scales for each homology
require(magrittr)
PD <- TDAstats::calculate_homology(
       data2.df %>% dplyr::filter(PID == 1) %>% dplyr::select(x,y),
       dim = 1,
       threshold = 10)
plot_persistence(PD = PD, title = "Example Persistence Diagram", dims = c(10, 10))